Accuracy Plateaus While Firing Rate Rises
Audits validation accuracy and firing-rate stability in unregularised PING and COBA training histories.
Abstract
We asked whether validation accuracy and firing rate settle together during training. We audited unregularised COBA and PING learning histories across seeds 42, 43, 44, using separate final-window stability criteria. Final mean E rates were 110.87 Hz for COBA and 16.38 Hz for PING; 3/3 COBA seeds met the accuracy criterion, versus 0/3 for E rate. Accuracy and activity therefore require separate convergence checks; these finite histories do not establish asymptotic stability.
Inputs
Uses the unregularised baseline learning histories from exp022 — MNIST: COBA and PING, seeds 42, 43, 44. The complete trajectories support comparisons throughout learning, rather than only at a selected checkpoint.
Results
COBA training trajectories
Final mean validation accuracy was 90.78% and E rate 110.87 Hz. The mean final-window E-rate slope was 0.777 Hz/epoch; 3/3 seeds met the accuracy criterion and 0/3 met the rate criterion (Fig. 1).

(A) Training and validation loss, (B) validation accuracy and (C) E firing rate for COBA, with 3 seeds shown separately. Training loss is solid and validation loss dashed.
PING training trajectories
Final mean E and I rates were 16.38 and 106.55 Hz. The mean final-window E-rate slope was 0.081 Hz/epoch; 3/3 seeds met the accuracy criterion and 0/3 met the rate criterion (Fig. 2).

(A) Training and validation loss, (B) validation accuracy and (C) E/I firing rates for PING, with 3 seeds shown separately. E rate is solid and I rate dashed; curves show individual seeds without uncertainty bands.
COBA-PING endpoint comparison
The 99%-of-final-accuracy markers do not establish sustained convergence. These reused training observations are not a direct measurement of confidence or a causal rate–margin relation (Fig. 3).

(A) Validation accuracy, (B) cross-entropy on a log axis and (C) E rate; COBA red, PING black, 3 seeds each. Dotted lines show each architecture’s mean first epoch reaching 99% of its final accuracy.
Methods
We assessed finite changes in accuracy, activity and weights using recorded learning histories from unregularised classifiers.
-
Select the baseline histories. We reused all 3 seeds per architecture from the unregularised activity comparison. Each history contains 50 consecutive completed epochs; final values refer to the last epoch, not the checkpoint selected by minimum validation loss. The audit involved no new training or inference.
-
Identify the evaluation split. The training pool contained 7000 images from MNIST’s official training partition, split into 6300 optimisation samples and 700 validation samples. The official test partition of 10000 images was not used during training. Per-epoch evaluation averaged 3 fixed encoder draws per validation sample; those draws are not independent training seeds.
-
Recover the training conditions. Images drove 784 Poisson input channels at a maximum pixel rate of 25 Hz for 200 ms, with a 0.1 ms timestep. The networks used 1024 excitatory and 256 inhibitory hidden neurons and 10 output neurons. Mean output membrane voltage supplied the class logits. Training used surrogate gradients[1], learning rate 0.0004 and batches of 256. Voltage-gradient damping was 1 for COBA and 1000 for PING; no activity regulariser was applied.
-
Measure final-window drift. For each seed, we recorded validation accuracy, training and validation cross-entropy, and population-mean E and I rates. The final 10 epochs define the endpoint slope
Here is a measurement at epoch , is the final epoch, is the window length, and is change per epoch. Absolute slopes below 0.1 percentage points/epoch for accuracy or 0.05 Hz/epoch for E rate meet the audit’s operational stability criterion. This endpoint diagnostic does not exclude fluctuations within the window or prove asymptotic convergence.
We recorded per-seed slopes, first-to-final-epoch weight-norm ratios, and final-window weight-norm slopes, and computed means and sample standard deviations across seeds. Curves show individual seeds. The first epoch reaching 99% of final accuracy supplies a separate descriptive marker, averaged across seeds; it does not require subsequent accuracy to stay above the threshold.
-
Display recorded trajectories. We displayed individual-seed learning curves and across-seed endpoint summaries with the recorded stability thresholds and aggregation.
Discussion
Cross-entropy can keep rewarding larger decision gaps after the predicted class becomes correct:
Here is cross-entropy for one example, its true class, an alternative class, and their logits, and the softmax probability of the true class. The decision margin determines correctness by its sign, whereas cross-entropy depends on all the logit gaps. Aggregate accuracy can remain steady while individual predictions change.
The continued activity drift is consistent with ongoing optimisation, but these curves do not establish that confidence growth causes the rate increase. The mean-membrane readout depends on synaptic drive and membrane dynamics; it is not simply a linear function of the mean E rate. PING’s lower activity and slower drift in this comparison do not demonstrate a fixed-rate attractor or isolate a causal benefit of gamma timing.
Network diagrams
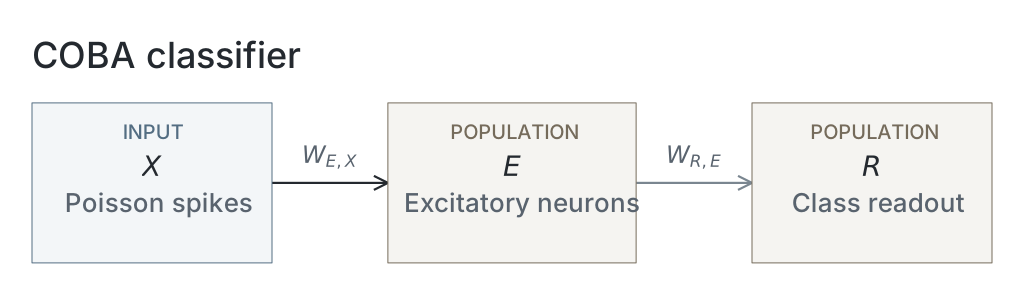
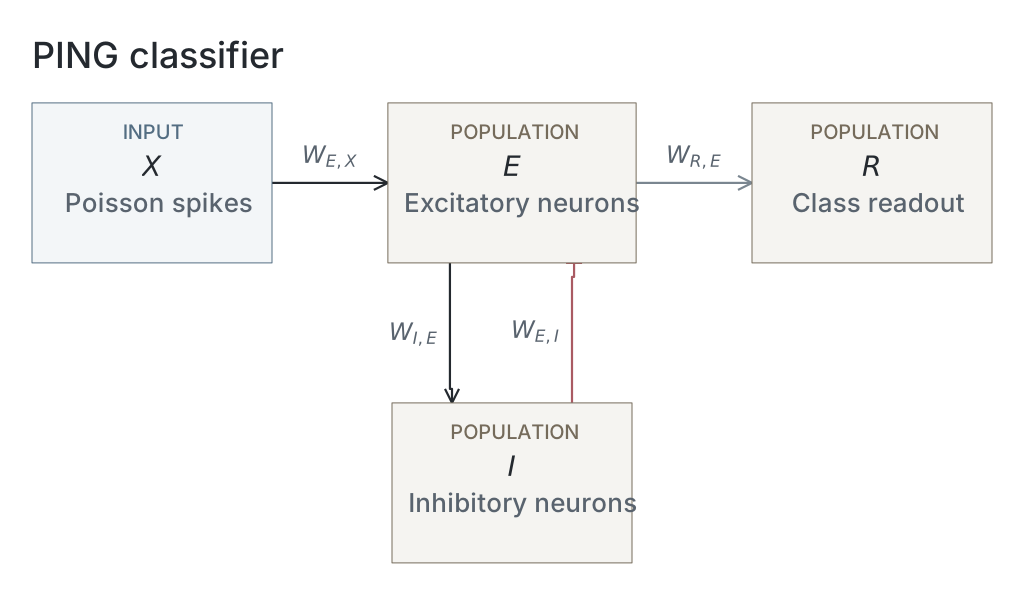
Parameters
This experiment audits recorded learning histories without simulating a new network. The original training models belong to exp022. Their native snapshots are unavailable in the historical evidence; current recipe settings are not replacement model evidence. These analysis settings come from the same selected audit as the figures.
| Analysis setting | Recorded value |
|---|---|
| History audit | |
| accuracy marker fraction | 0.99 |
| accuracy threshold pp per epoch | 0.1 |
| rate threshold hz per epoch | 0.05 |
| slope estimator | endpoint_secant |
| threshold rule | absolute_slope_strictly_below |
| training run | TR-02 |
| window epochs | 10 |
Dataset
Downstream: —
Current runset
| Run | Date | Duration | Size | Evidence | Storage | Ran on | Verification |
|---|---|---|---|---|---|---|---|
| exp024-r002-present | 1s | 198.3 KB | Current | R2 | Local | Local: absent; R2: catalog-verified | |
| exp024-r001-analyse | 1s | 119.5 KB | Current | R2 | Local | Local: absent; R2: catalog-verified | |
| exp022-r001-compute | 2d 7h 4m 16s | 2 GB | Current | R2 | HPC | Local: absent; R2: catalog-verified |
References
- E. O. Neftci, H. Mostafa, and F. Zenke. “Surrogate Gradient Learning in Spiking Neural Networks.” IEEE Signal Processing Magazine 36(6), 51–63 (2019). doi:10.1109/MSP.2019.2931595