Pool Size and Synaptic Scaling
Paired controls separate fixed summed I→E coupling from fixed expected synaptic strength as the inhibitory pool grows.
Abstract
We tested inhibitory pool size under two controls: fixed summed inhibition and fixed expected per-synapse strength. Across 3 seeds, increasing I size from 16 to 256 changed mean E firing from 6.01 to 6 Hz at fixed summed coupling, versus 16.62 to 6 Hz at fixed synaptic strength. Pool-size effects depended on scaling. These untrained-network rates do not by themselves establish gamma oscillations.
Results
Pool-size scaling response
At nominal 2 μS, E rates changed from 6.01 to 6 Hz across 16–256 I neurons. At 7.81 nS, E rates fell from 16.62 to 6 Hz and I rates from 120.41 to 34.41 Hz. All tested fixed-mean levels showed this decrease, consistent with stronger summed inhibition and reduced E–I feedback (Fig. 1).

Reanalysed population firing rates. (A) Excitatory (E) rate with fixed expected summed coupling ; (B) E rate with fixed expected synaptic strength ; (C) inhibitory (I) rate with fixed summed coupling; (D) I rate with fixed synaptic strength. Markers are means ±1 sample standard deviation across 3 seeds, with 8 trials per seed. Shared conditions reused the same simulations.
Methods
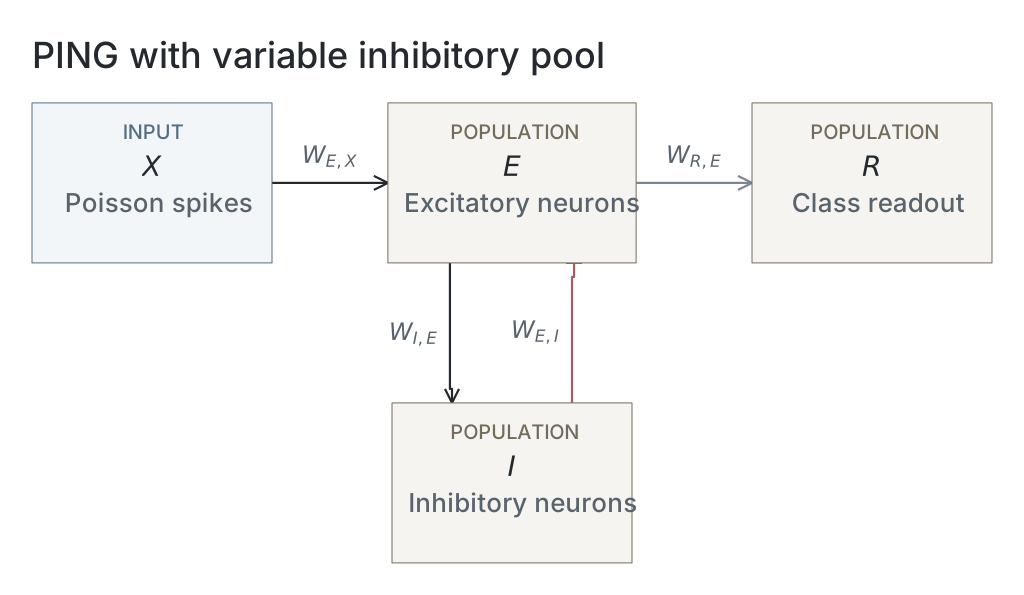
We compared two scaling controls using recorded outputs from simulations of untrained, dense recurrent excitatory–inhibitory networks, without additional simulation.
-
Initialize fan-in-normalized weights. For an I→E matrix with 1024 excitatory columns and inhibitory rows, each weight was , with and a Gaussian draw of mean and standard deviation , in μS. Defining expected summed coupling gives
Here averages over weight initialization, indexes inhibitory neurons and excitatory neurons; is the expected conductance of one synapse, not an identical realised weight. An inhibitory volley gives
where is the active inhibitory set and the inhibitory conductance increment at E neuron , in μS; both weights and participation therefore enter the increment.
-
Apply paired pool-size controls. We swept 16, 64, 256. Fixed-summed controls used parent means 1, 2, 4 μS, so ; fixed-mean-synapse controls scaled with , giving nominal 3.90625, 7.8125, 15.625 nS. Nominal values approximate the post-clamp expectations; the arms coincide at 256 I neurons, with one additional shared condition at 64 I neurons and nominal 1 μS summed coupling.
-
Drive and measure the networks. Nominal E→I summed coupling stayed at 1 μS; input weights used parent mean 1.2 μS, 95% initial zeros, compensation for zeroing and fan-in normalization. Each network received 784 independent 25 Hz input channels, implemented as Bernoulli spikes per 0.1 ms timestep, for 500 ms and 8 trials, with seeds 40, 41, 42. We included all conditions and averaged spike counts over the full duration, trials and neurons within each population; overlapping controls reused measurements, giving 3 seeds at each of 18 conditions from 42 distinct simulations. The reanalysis used these rates, not raw spike trains; population rates alone do not establish gamma oscillations [1].
-
Display pool-size comparisons. We displayed the recorded population-rate responses for fixed total and fixed per-synapse coupling with their shared controls and seed aggregation.
Network diagrams
Parameters
Model values are read from original native snapshots through the selected presentation’s compute ancestry. Paired values are E / I. Initializer parent means and SDs describe the original weight distributions, in µS for conductance projections and dimensionless for the current-based readout; they are not measured trained-weight statistics. Missing snapshots or fields are unavailable; current recipes and historical copied tables are not substituted. The recorded configuration identifies the input, numerical and analysis choices of that computation; it does not establish a separate upstream training protocol.
| Parameter | 16 I cells | 256 I cells |
|---|---|---|
| Network | ||
| E / I neurons | Unavailable / Unavailable | Unavailable / Unavailable |
| Output neurons | Unavailable | Unavailable |
| Neurons | ||
| Capacitance, E / I (nF) | Unavailable / Unavailable | Unavailable / Unavailable |
| Leak conductance, E / I (µS) | Unavailable / Unavailable | Unavailable / Unavailable |
| Resting voltage, E / I (mV) | Unavailable / Unavailable | Unavailable / Unavailable |
| Threshold, E / I (mV) | Unavailable / Unavailable | Unavailable / Unavailable |
| Reset, E / I (mV) | Unavailable / Unavailable | Unavailable / Unavailable |
| Refractory period, E / I | Unavailable / Unavailable | Unavailable / Unavailable |
| Synapses and weights | ||
| Input→E synapse | Unavailable / Unavailable | Unavailable / Unavailable |
| E→I synapse | Unavailable / Unavailable | Unavailable / Unavailable |
| I→E synapse | Unavailable / Unavailable | Unavailable / Unavailable |
| E→Output synapse | Unavailable / Unavailable | Unavailable / Unavailable |
| Input→E initializer parent mean / SD | Unavailable / Unavailable | Unavailable / Unavailable |
| E→I initializer parent mean / SD | Unavailable / Unavailable | Unavailable / Unavailable |
| I→E initializer parent mean / SD | Unavailable / Unavailable | Unavailable / Unavailable |
| E→Output initializer parent mean / SD | Unavailable / Unavailable | Unavailable / Unavailable |
| Native parameter stage | Unavailable | Unavailable |
| Input and simulation | ||
| Timestep (ms) | Unavailable | Unavailable |
| Duration (ms) | 500 | 500 |
| Evaluation samples | Unavailable | Unavailable |
| Seeds | 40 / 41 / 42 | 40 / 41 / 42 |
| Input rate (Hz) | 25 | 25 |
| Post-burn exclusion (ms) | Unavailable | Unavailable |
| Readout and training | ||
| Output neuron model | Unavailable | Unavailable |
| Epochs | Unavailable | Unavailable |
| Checkpoint role | Unavailable | Unavailable |
| Checkpoint purpose | Unavailable | Unavailable |
| Analysis | ||
| Frequency search (Hz) | Unavailable | Unavailable |
| Count-bin width (ms) | Unavailable | Unavailable |
| Autocorrelation maximum lag (ms) | Unavailable | Unavailable |
Dataset
Upstream: —
Downstream: —
Current runset
| Run | Date | Duration | Size | Evidence | Storage | Ran on | Verification |
|---|---|---|---|---|---|---|---|
| exp047-r003-present | <1s | 140.3 KB | Current | R2 | Local | Local: absent; R2: catalog-verified | |
| exp047-r002-analyse | <1s | 17.3 KB | Current | R2 | Local | Local: absent; R2: catalog-verified | |
| exp047-r001-compute | 4m 49s | 36.1 KB | Current | R2 | Unknown | Local: absent; R2: catalog-verified |
References
- G. Buzsáki and X.-J. Wang. “Mechanisms of Gamma Oscillations.” Annual Review of Neuroscience 35, 203–225 (2012). doi:10.1146/annurev-neuro-062111-150444