SHD
Full-data SHD training curves and matched two-layer inference rasters for COBA and PING.
Abstract
We compared two-layer conductance-based classifiers on 20 spoken-digit classes, using one seed, one-second inputs and the same corrupted training and validation utterances. After 50 epochs, development-validation accuracy was 82.5% for COBA and 84.1% for PING. One preselected validation utterance illustrates the final weights’ activity. This paired replicate does not establish official-test performance or a general benefit from inhibition.
The report selects the latest completed presentation available from the run store. Figures, numerical summaries and native parameter snapshots follow that presentation’s recorded analysis and compute ancestry. The full-data run uses SNNLab’s native train and simulate APIs, native snapshots and zero-decay AdamW, retaining the one-second truncation and input corruption. The archived publication preserves the earlier account.
Results
COBA training
After 50 epochs, online training accuracy was 84.4% and validation accuracy 82.5% (Fig. 1B). Validation cross-entropy fell from 3.0055 to 0.5807 (Fig. 1A). All three learned matrices changed and final weights were finite. The condition took 52 minutes, including 45.4 minutes training and 6.6 minutes validation, excluding acquisition, setup and transfer. This is one development-holdout replicate, not an official-test evaluation.
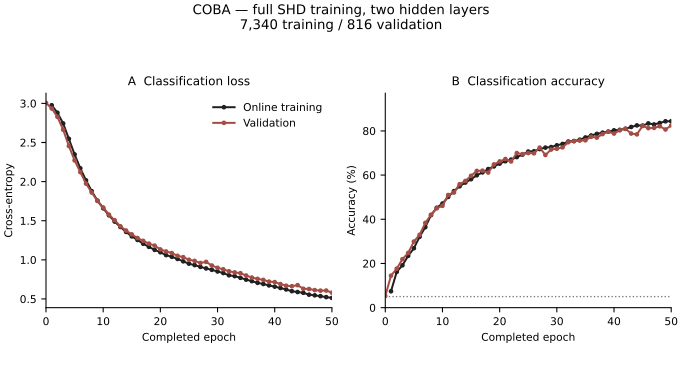
Recorded COBA training curves. We trained two 128-neuron excitatory layers on 7,340 utterances and evaluated 816 held-out utterances. (A) Example-average classification cross-entropy. (B) Classification accuracy; the dotted line marks 5% uniform random guessing across 20 classes. Black lines/circles show online pre-update minibatch measurements aggregated over each epoch; red lines/circles show complete validation with that epoch’s final weights. Epoch zero contains validation only. Each curve is one seed-42 replicate, without averaging or uncertainty bands. Class counts are naturally unequal; the split is utterance-disjoint, not speaker-disjoint.
PING training
With fixed reciprocal feedback in both 128 E/32 I layers, online training accuracy was 89.3% and validation accuracy 84.1% (Fig. 2B). Validation cross-entropy fell from 3.1003 to 0.4629 (Fig. 2A). All three learned matrices changed and final weights were finite. The condition took 60.4 minutes, including 52 minutes training and 8.4 minutes validation. The two conditions ran concurrently on separate H100 GPUs. Higher validation accuracy in this pair does not establish a general inhibitory advantage or its mechanism.
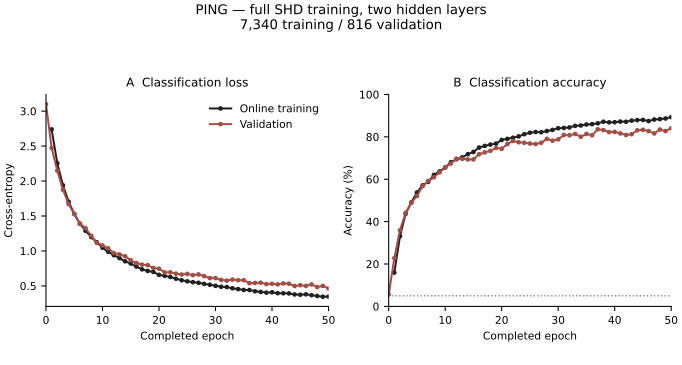
Recorded PING training curves. We used the same training/validation utterances, initial learned matrices, sample order and corruption streams as COBA. (A) Example-average classification cross-entropy. (B) Classification accuracy, with 5% uniform-guessing accuracy dotted. Black lines/circles are online pre-update measurements aggregated over the epoch; red lines/circles are full validation with final epoch weights. Epoch zero contains validation only. Each curve is one seed-42 replicate, without averaging or uncertainty bands. The official test set was not evaluated.
COBA two-layer response
We replayed the first utterance in the validation split through the final trained weights, without optimizer updates. The true class was 0, and COBA predicted class 7. Both layers responded during the utterance (Fig. 3). This fixed example illustrates activity propagation; it was not selected for correct classification or its raster appearance and cannot summarize performance across utterances.
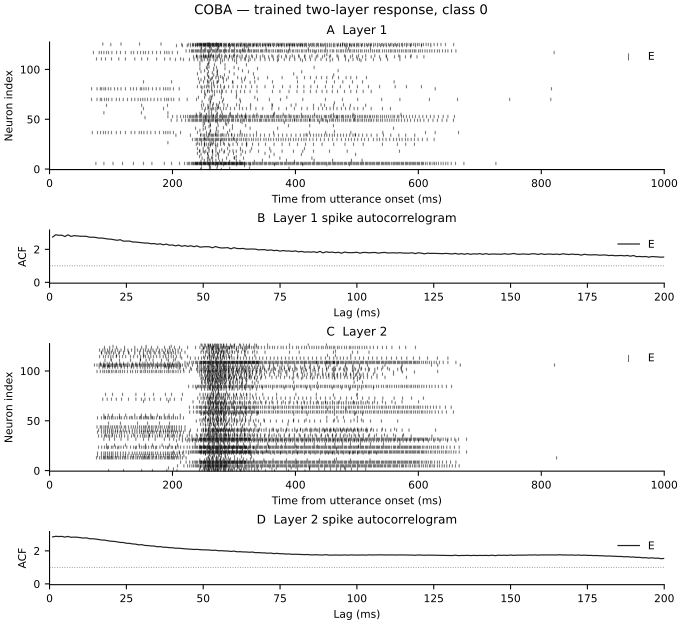
Recorded COBA inference raster. We presented one held-out SHD utterance with a fresh seeded insertion/deletion draw and fixed final-epoch weights. (A, C) Layer 1 and layer 2 rasters. Each black tick is one spike; horizontal position is elapsed time from utterance onset and vertical position identifies a neuron. Each raster contains 128 excitatory neurons and no inhibitory population. The full one-second presentation is shown, with no smoothing, trial average or transient removal. The same input events were used for PING in Figure 4. (B, D) Corresponding layer population spike-count autocorrelograms in 1 ms bins. We divided each uncentered lagged product sum by the number of overlapping bins and the squared full-utterance mean count (Equation 2). Black traces show E at positive lags up to 200 ms; zero lag is omitted because of self-pairs. The dotted line at one marks the expected baseline for independent stationary activity. These are population-count correlations, not averages of individual-neuron autocorrelations; each y axis includes the full displayed peak.
PING two-layer response
PING predicted class 0 for the same true-class-0 utterance. The raster shows intermittent excitatory responses and synchronized inhibitory events in both layers (Fig. 4). Identical inhibitory parameters and uniform incoming feedback produce identical inhibitory spike trains within a layer. This response is illustrative; the raster alone does not establish a rhythm’s frequency or show why PING trained more accurately.
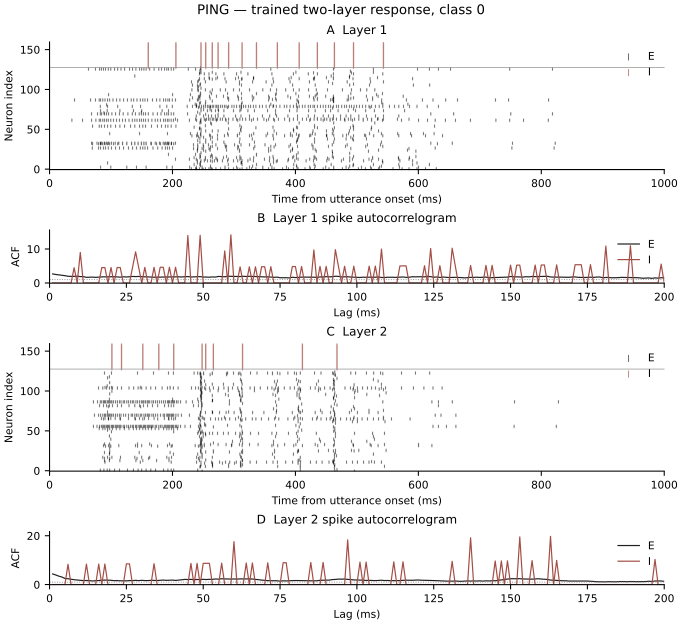
Recorded PING inference raster. We used the same utterance and corruption draw as COBA, with final-epoch weights fixed and no optimization. (A, C) Layer 1 and layer 2 rasters. Black ticks identify spikes from 128 excitatory neurons, indexed 0–127; red ticks identify spikes from 32 inhibitory neurons stacked above them, indexed 128–159. Time runs horizontally from utterance onset. The thin horizontal line separates populations. Both rasters show the full one-second presentation without smoothing, averaging or removal of the initial transient. (B, D) Corresponding population-count autocorrelograms, calculated separately for E (black) and I (red) with the same 1 ms bins, overlap correction and squared-mean normalization as Figure 3 (Equation 2). Positive lags extend to 200 ms, with zero lag omitted and no trial averaging. The dotted line at one marks the independent stationary baseline; each y axis includes both populations’ full displayed peaks. The single stimulus-evoked response includes its changing activity envelope and does not establish a sustained oscillation.
Methods
The executed architecture and simulation settings are listed in Table 1. The parameter table reads saved final-training snapshots and that compute run’s recorded configuration, following the same selected presentation ancestry as the figures. Missing snapshots are shown as unavailable; current recipe settings and old exported table rows are not substituted.
-
Prepare SHD. We split 8,156 official training utterances [1] (20 classes, 700 channels) into 7,340 training and 816 validation examples using a seed-42 per-class shuffle. Original spike-train lengths varied: last-spike times ranged from 0.233 to 1.369 s. We kept only events before 1 s to fit the simulation, flooring times into binary 1 ms bins. Speakers could overlap between splits; the official test set was unused.
-
Corrupt inputs. Per channel and 1 ms bin, we deleted existing spikes with probability 0.0008 and filled empty bins with probability 0.0016 (approximately 1.6 Hz). Both models shared example order and noise draws; validation noise stayed fixed across epochs for consistent comparison. Corruption exposed models to missing and extra spikes, but its benefit was not tested against uncorrupted training.
-
Initialize hidden weights. Both models shared seed-42 learned matrices. SNNLab’s LowerClampedNormal used parent mean 0.09 μS and SD 0.009 μS. Input→E1 and E1→E2 initial zero fractions were 0.95 and 0.90, followed by division by retained fan-in (35 and 12.8). Negative draws were clamped; initial zeros remained trainable and weights remained nonnegative.
-
Initialize readout and feedback. Signed E2→readout weights had Gaussian mean zero and SD 0.1 μS, centered across source neurons for each class, without sparsification or fan-in scaling. PING feedback was fixed at μS per E→I edge and μS per I→E edge: 0.05 μS summed incoming conductance in either direction. COBA had no inhibitory feedback.
-
Score utterances. We used a custom rate-normalized mean-voltage score:
Here is the score for class , its mean non-spiking readout voltage, and the per-neuron E2 rate, both over the full second. We used gain , reference rate and rate floor , predicting the largest score. The positive scaling preserves that choice for fixed weights but changes cross-entropy and training gradients.
-
Train both models. We used SNNLab’s train for 50 epochs with class-stratified batches of 256, merging tails smaller than 20. AdamW with zero weight decay minimized mean cross-entropy per represented class; input/interlayer/readout learning rates were , with betas 0.9/0.999 and no weight decay. The FastSigmoid surrogate used slope and gradient scale 0.01. States reset per utterance. Reported losses were example means; validation used epoch-end weights, including epoch zero.
-
Record matched responses. Using SNNLab’s simulate, we replayed the first validation utterance with final-epoch weights, one shared fresh corruption draw (seed 46) and no updates. Selection used validation split order, not original dataset index, prediction or spike appearance.
-
Calculate autocorrelograms. We applied SNNLab’s spike_autocorrelogram separately to each population over the full utterance:
Here is dimensionless autocorrelation for population (E or I in one layer), its count in bin , and its mean across bins. We used 1 ms bins and integer lags (1–200 ms). Independent stationary activity has baseline one; zero lag is omitted, and silent or too-short recordings give undefined curves. No smoothing, transient removal or trial averaging was applied; the stimulus-evoked activity envelope contributes to the correlation.
References
- Cramer, B., Stradmann, Y., Schemmel, J., and Zenke, F. The Heidelberg Spiking Data Sets for the Systematic Evaluation of Spiking Neural Networks. IEEE Transactions on Neural Networks and Learning Systems, 33, 2744–2757 (2022). doi:10.1109/TNNLS.2020.3044364.
Network diagrams


Executed network circuits. (A) COBA. (B) PING. denotes input channels, and the two hidden layers, and the analogue readout. Every synaptic projection is labelled , with target first and source second. Arrowheads show excitation; bars show inhibition. The diagrams are laid out from the saved executed definitions. Recording aliases and subsequent score reductions, scaling and normalization are omitted; Equation 1 defines the score.
Parameters
| Parameter | COBA | PING |
|---|---|---|
| Network | ||
| Input channels | 700 | 700 |
| Hidden layer 1 neurons, E / I | 128 / — | 128 / 32 |
| Hidden layer 2 neurons, E / I | 128 / — | 128 / 32 |
| Neuron model, E / I | coba_lif / — | coba_lif / coba_lif |
| Neurons | ||
| Membrane capacitance, E / I | 1 / — nF | 1 / 0.5 nF |
| Leak conductance, E / I | 0.05 / — µS | 0.05 / 0.025 µS |
| Passive time constant, E / I (derived) | 20 / — ms | 20 / 20 ms |
| Resting potential, E / I | -65 / — mV | -65 / -65 mV |
| Reset potential, E / I | -65 / — mV | -65 / -65 mV |
| Spike threshold, E / I | -50 / — mV | -50 / -50 mV |
| Refractory period, E / I | 0 / — ms | 0 / 0 ms |
| Synapses and weights | ||
| Input→E1 synapse / decay | ampa / 10 ms | ampa / 10 ms |
| E1→E2 synapse / decay | ampa / 10 ms | ampa / 10 ms |
| E→I / I→E synapse decay | Not applicable | 10 / 10 ms |
| E→I / I→E feedback delay | Not applicable | 1 / 1 ms |
| Input→E1 initial Gaussian parent mean / SD | 0.09 / 0.009 µS | 0.09 / 0.009 µS |
| E1→E2 initial Gaussian parent mean / SD | 0.09 / 0.009 µS | 0.09 / 0.009 µS |
| Input→E1 / E1→E2 initial zero fraction | 0.95 / 0.9 | 0.95 / 0.9 |
| Input→E1 / E1→E2 initialization scaling | fan_in_normalized / fan_in_normalized | fan_in_normalized / fan_in_normalized |
| Initial summed feedback, E→I / I→E (derived) | Not applicable | 0.05 / 0.05 µS |
| Trainable matrices | E1_to_E2.weight, input_to_E1.weight, readout_projection.weight | E1_to_E2.weight, input_to_E1.weight, readout_projection.weight |
| Input and simulation | ||
| Dataset source | https://zenkelab.org/datasets/shd_train.h5.gz | https://zenkelab.org/datasets/shd_train.h5.gz |
| Official test evaluated | No | No |
| Training / validation utterances | 7340 / 816 | 7340 / 816 |
| Validation holdout fraction / split seed | 0.1 / 42 | 0.1 / 42 |
| Timestep / presentation | 1 / 1000 ms | 1 / 1000 ms |
| Input insertion rate / spike deletion probability | 1.6 Hz per channel / 0.0008 | 1.6 Hz per channel / 0.0008 |
| Readout | ||
| Output neurons / spiking | 20 / no | 20 / no |
| Readout membrane / synapse decay | 20 / 10 ms | 20 / 10 ms |
| E2→readout initial Gaussian mean / SD | 0 / 0.1 µS; source-centered | 0 / 0.1 µS; source-centered |
| Fixed score-gain initializer | 20 | 20 |
| Score reference rate / rate floor | 20 / 1 Hz | 20 / 1 Hz |
| Classification score | Rate-normalized mean readout voltage (Equation 1) | Rate-normalized mean readout voltage (Equation 1) |
| Training | ||
| Epochs / batch size / seed | 50 / 256 / 42 | 50 / 256 / 42 |
| Optimizer / objective | adamw / equal-class cross-entropy | adamw / equal-class cross-entropy |
| Learning rates, input / interlayer / readout | 0.000005 / 0.00002 / 0.01 | 0.000005 / 0.00002 / 0.01 |
| Adam betas / epsilon / weight decay | 0.9, 0.999 / 1e-8 / 0 | 0.9, 0.999 / 1e-8 / 0 |
| Surrogate slope / gradient scale | 6.66667 mV⁻¹ / 0.01 | 6.66667 mV⁻¹ / 0.01 |
| Training measurement | online_pre_update_minibatches | online_pre_update_minibatches |
| Analysis | ||
| Autocorrelogram bin / maximum lag | 1 / 200 ms | 1 / 200 ms |
| Diagnostic counting window | 0–1000 ms; full presentation | 0–1000 ms; full presentation |
exp124-r003-compute; execution settings come from that run's recorded configuration.
E / I pairs list excitatory then inhibitory values; an em dash means that population is absent.
The passive time constant is capacitance divided by leak conductance. Initializer statistics describe initial draws, not the final learned weight distribution; initial summed feedback is the per-edge constant times the source population size.
Readout voltage and E2 rate are averaged over the full presentation; states reset between utterances.
Missing native snapshots are shown as unavailable, without substituting recipe defaults or previously exported table rows.
Dataset
Upstream: —
Downstream: —
Current runset
| Run | Date | Duration | Size | Evidence | Storage | Ran on | Verification |
|---|---|---|---|---|---|---|---|
| exp124-r005-present | 1s | 529.6 KB | Current | Both | Local | Local: byte-verified; R2: catalog-verified | |
| exp124-r004-analyse | <1s | 796.5 KB | Current | Both | Local | Local: byte-verified; R2: catalog-verified | |
| exp124-r003-compute | 1h 1m 30s | 3.2 MB | Current | Both | Unknown | Local: byte-verified; R2: catalog-verified |